
 Oct 20,2026
A plastic thermoforming machine can be mechanically sound and still lose money through low availability, slow cycles, or excessive energy waste. The two numbers that expose this gap are OEE and energy cost per good part. This guide explains how to measure both, identifies where energy actually goes on a thermoforming line, and provides a practical framework for improvement across heating, compressed air, cooling, scrap, and mold changeover.
OEE (Overall Equipment Effectiveness) is calculated as Availability × Performance × Quality.
In a thermoforming context:
A line that runs at 85% availability, 80% performance, and 95% quality has an OEE of approximately 65%. That means roughly one-third of planned production time is being lost to some combination of stops, speed loss, and defects.
The reason OEE matters more than any single metric is that it separates the three loss types. A line with high availability but low performance needs a different intervention than a line with high performance but frequent breakdowns. Without measurement, improvement efforts are guesswork.
Data collection can start manually—shift logs recording downtime reasons, cycle counts, and reject counts. More advanced systems use PLC data via OPC UA or similar protocols to capture machine states automatically and calculate OEE in real time.
Before optimizing energy, it helps to understand where it goes. The split depends on machine type—plate thermoforming versus roll-fed automatic machines—and on whether sheet extrusion is inline.
For plate thermoforming machines, heating accounts for more than 70% of energy demand; the remainder is electric motors, compressed air generation, and cooling/temperature control units. For roll-fed automatic machines and inline extrusion-thermoforming setups, the picture shifts: compressed air generation and heating the semi-finished product can together account for up to 60% of the thermoformer’s total energy requirement.
At the cup manufacturing level, energy costs—electricity, heating, cooling, and compressed air—typically represent 15–25% of total production costs, with electricity consumption in the range of 0.8 to 1.5 kWh per thousand cups, depending on machine efficiency and production parameters. A plastic thermoforming machine consumes approximately 15–45 kW during active production, with compact machines at the lower end and large lines at the upper end.
| Machine / Line Type | Dominant Energy Load | Planning Implication |
|---|---|---|
| Plate thermoforming | Heating (>70%) | Focus on radiation efficiency, zoning, insulation |
| Roll-fed automatic | Compressed air + heating (up to 60% combined) | Audit leaks, optimize vacuum, check heater control |
| Inline extrusion + thermoforming | Heating + extruder drive + cooling | Coordinate sheet residual heat, extruder efficiency, chiller load |
| Cup line (summary metric) | 0.8–1.5 kWh per 1,000 cups | Track per-1,000-part energy as a KPI |
These ranges are planning references, not guarantees. Actual consumption varies by material, thickness, cycle time, mold design, and ambient conditions.
Heating is the largest single energy load on most thermoforming lines. Improvements come from three areas: the radiation source, the control strategy, and the thermal environment.
Radiation source. Ceramic infrared radiators with integrated thermal insulation have demonstrated measurable energy savings compared with conventional full-ceramic radiators. In controlled evaporation tests representative of thermoforming heating tasks, ELSTEIN HTS-series radiators required approximately 0.193 kWh versus 0.229 kWh for a conventional FSR radiator and 0.277 kWh for another manufacturer’s FSR design—energy savings of roughly 15% relative to the first comparator and about 30% relative to the second. The savings potential improves when the heating task has a shorter cycle time. Other infrared heating systems have reported energy reductions of 40% or more compared with conventional Calrod heaters in measured tests, with some ceramic systems exceeding 45%.
Zoning and control. Heating zones allow different areas of the sheet to receive different energy inputs. This is useful for products with uneven wall thickness or complex geometry. PID control maintains zone temperature more stably than on/off control, reducing overshoot and unnecessary energy input. The goal is not maximum heater power but minimum energy that still produces consistent forming.
Insulation and environment. Integrated insulation on the radiator back reduces heat loss to the machine frame and surrounding air. Enclosing the heating station or adding heat shields can further reduce losses. In hot climates, removing heat from the workshop via ventilation costs money; reducing radiant heat loss at the source reduces both energy consumption and cooling load.
A practical check: measure energy consumption per 1,000 parts before and after a heater or control change. Without that number, improvement is assumed rather than verified.
Thermoforming relies on positive and negative pressure to form sheet into the mold. Compressed air and vacuum are therefore core process utilities—and common sources of waste.
Industry experience indicates that between leaks, improper use, and artificial demand, nearly half the air produced in a typical plastics plant may be wasted. This is not a thermoforming-specific figure, but it indicates the scale of the opportunity.
The main levers:
A leak audit is a low-cost starting point. It does not require new equipment, and the findings are usually actionable within days.
Cooling affects both quality and cycle time. If the mold runs too hot, cycle time must be extended to allow the part to solidify; if cooling is uneven, warping and dimensional variation increase.
Key factors:
Cooling optimization is often overlooked because it does not show up as a single line item. But an inefficient cooling system manifests as slower cycles and higher scrap—both of which are OEE losses.
Scrap is both a quality loss (reducing the Quality factor in OEE) and a material cost. Scrap reduction levers fall into three categories.
Material levers. Sheet thickness tolerance, moisture content (especially for PET and PLA), and regrind quality all affect forming yield. Regrind can often be blended with virgin material, but the acceptable ratio depends on the product and material; some sources indicate that blends below 50% regrind did not affect thermoformability in specific tested systems, but this must be verified for each application. For food-contact products, regrind use must comply with the applicable regulatory framework.
Mold levers. Cutting edge condition, vacuum hole condition, and mold surface quality directly affect trim quality and forming consistency. A worn cutting edge produces ragged trim and higher reject rates.
Process levers. Heating uniformity, forming pressure/vacuum, cooling time, and plug assist settings all influence whether a part forms completely and cleanly. Many scrap problems attributed to “bad material” are actually process window issues.
A simple scrap Pareto—by product, by shift, by defect type—usually reveals that a small number of causes account for most of the loss. Addressing those causes first produces the largest return.

Changeover time is an Availability loss. In thermoforming, mold changes involve stopping production, removing the old mold, installing and aligning the new mold, connecting cooling and vacuum, setting parameters, and running trial parts until quality is acceptable.
SMED (Single-Minute Exchange of Die) methodology separates internal setup (work that requires the machine stopped) from external setup (work that can be done while the machine is running). Applying SMED to a thermoforming line has been documented to reduce setup time from 56.25 minutes to 22.3 minutes in a published case study—a reduction of more than 60%—while contributing to an availability improvement from 80% to 93% when combined with TPM and standardized work. Another study reported changeover time reduced to around 8 minutes after redesigning mold mounting elements.
Practical SMED actions on a thermoforming line:
The specific time savings depend on the machine and mold design, but the direction is consistent: externalizing setup work and standardizing interfaces reduces downtime.
The following framework is a starting structure, not a guaranteed result. Actual savings depend on baseline conditions, material, and operating discipline.
Week 1 — Measure the baseline.
Week 2 — Find the largest losses.
Week 3 — Implement no-cost and low-cost actions.
Week 4 — Re-measure and standardize.
This sequence starts with measurement because improvement without a baseline cannot be verified. It prioritizes low-cost actions because they build confidence and fund further changes.
OEE = Availability × Performance × Quality. Availability is actual production time divided by planned production time. Performance is actual output divided by theoretical output at rated cycle speed. Quality is good parts divided by total parts produced. In thermoforming, changeover time, unplanned stops, speed loss, and scrap each map to one of these three factors.
Published industry references indicate energy costs of roughly 15–25% of total production cost, with electricity consumption in the range of 0.8–1.5 kWh per thousand cups for cup manufacturing, and machine power draw of approximately 15–45 kW during active production depending on machine size. These are planning ranges; actual consumption should be measured on the specific line.
Reported savings vary by baseline. Insulated ceramic infrared radiators have shown roughly 15–30% lower energy use than conventional full-ceramic designs in controlled tests, and infrared systems have reported savings of 40% or more compared with older Calrod heaters. The achievable saving on a given line depends on the existing heating technology, control strategy, and operating conditions.
Use an ultrasonic leak detector during production and check fittings, solenoid valves, hoses, and cylinder seals. Also verify that vacuum holes in molds are clear and that vacuum lines are not leaking. Industry experience suggests that a significant share of compressed air in plastics plants is wasted through leaks and artificial demand, so the audit often finds quick wins.
Changeover reduces Availability because the machine is stopped while the mold is changed. SMED methodology targets this loss by externalizing setup work and standardizing interfaces. Published case studies on thermoforming lines have reported changeover time reductions of more than 50%, contributing to measurable availability improvement.
There is no universal target. A line with high-mix, short-run production will have a lower availability ceiling than a line running one product for weeks. The practical approach is to establish the baseline, identify the largest loss category, and set a target for that category—not to chase a benchmark number from a different production environment.
OEE and energy cost are connected. A line that runs slowly to compensate for cooling problems, or that leaks compressed air through worn fittings, or that scraps parts because the heater zones are not controlled, is losing money on both dimensions simultaneously. The starting point is measurement: availability, performance, and quality for OEE; kWh per 1,000 good parts for energy. From there, the largest loss category points to the first improvement action.
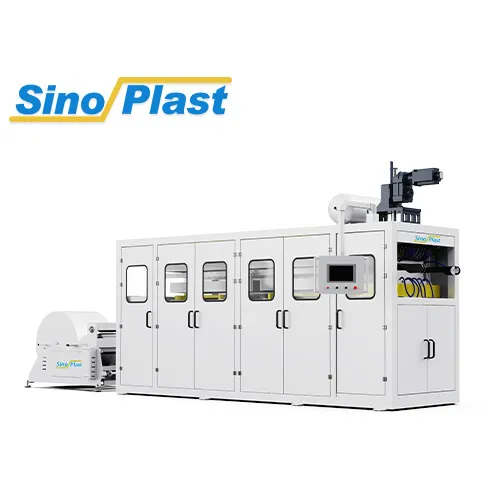
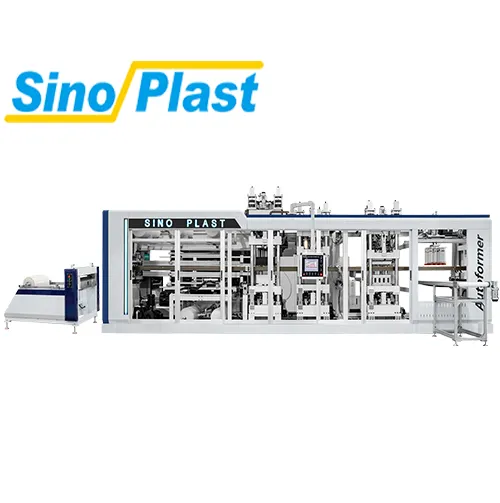
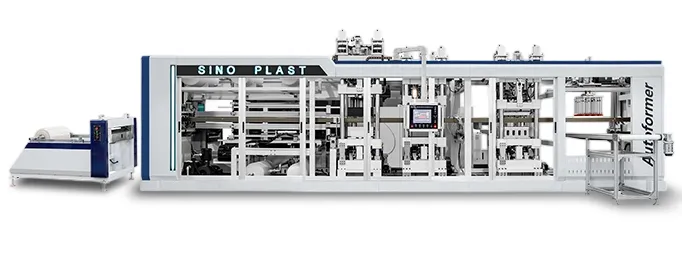
For lines where cycle time, heating configuration, or auxiliary equipment sizing is the limiting factor, reviewing the machine and auxiliary specifications against actual production requirements is the next step. The plastic thermoforming machine and plastic cup making machine pages show available configurations. To discuss a specific line’s OEE or energy baseline, contact the Sinoplast team through Contact Us.
We are a professional plastic machinery provider in China.